Op het blog van vandaag neem ik jullie mee naar Barneveld, waar het online veilingbedrijf BCA jaarlijks meer dan 50.000 voertuigen veilt. Het assortiment is breed: van auto’s tot vrachtwagens en motoren. Na een bezoek aan het bedrijf groeide mijn fascinatie voor hun bedrijfsprocessen. Hoe zou een dag daar eruitzien? Geïnspireerd door deze vraag, ben ik een simulatiemodel gaan ontwikkelen om het bedrijfsproces beter te begrijpen.
Een goede indruk maken op potentiële werkgevers of opdrachtgevers is essentieel als je een nieuwe baan of opdracht zoekt. Daarvoor heb je een CV nodig dat aansluit bij je doel en je kwaliteiten laat zien. Maar hoe houd je je CV up-to-date en relevant voor elke sollicitatie? Een zoektocht naar een praktische oplossing.
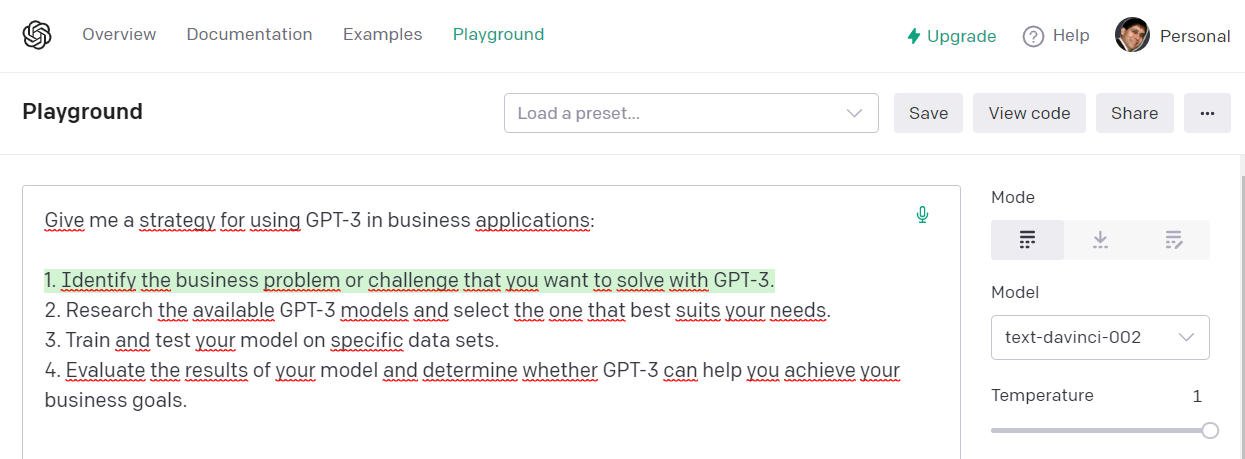
In this article I describe what GPT-3 is, the business case and a project that im currently working on.
GPT-3 is a wonderful new AI technology for handling text. Translation, question answering, summarization, and fact extraction can all be handled more effectively with the use of GPT-3. You don’t need to be an expert in machine learning technology to take advantage of this new AI technology – simply write simple text instructions like “Please summarise the following text.”
How can we use GPT-3 for business applications? To demonstrate I created a free account on openai.com and asked GPT-3 to help me to write this article together.
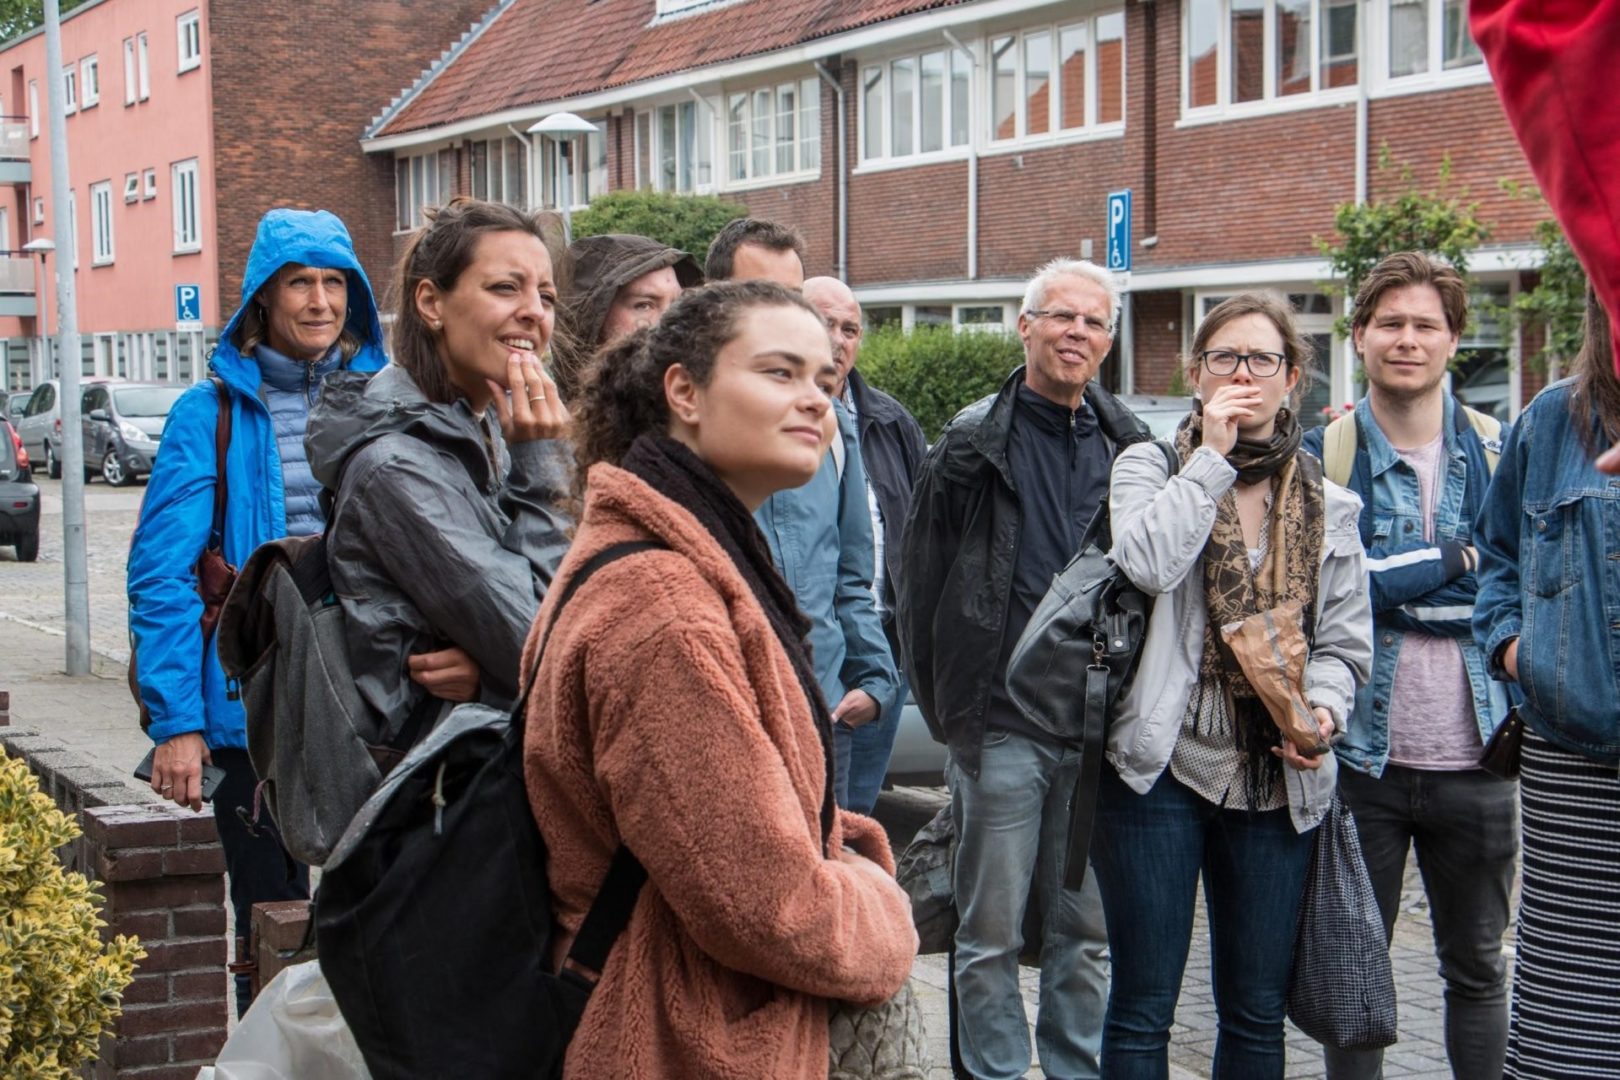
Op 15 juni was er een straatdiscussie met bewoners, gemeente en politiek over de verkeersveiligheid in de wijk. In dit artikel leest U hoe wij dit aanpakten, een samenvatting en een lijst met actiepunten voor de wijk en de gemeente. Conclusie: wij kunnen de veiligheid snel en eenvoudig verbeteren door probleempunten zoals goed zicht op kruispunten voortvarend aan te pakken.
Wat kan je doen om de verkeersveiligheid in je wijk structureel te verbeteren. Maak een goed overzicht van de verkeersveiligheid situatie. Werk samen met de gemeente om risico’s in kaart te brengen en terug te dringen. Het Strategisch Plan Verkeersveiligheid (SPV) introduceert een nieuw perspectief: risico’s in het verkeer structureel terugdringen in plaats van maatregelen treffen als er ergens ongevallen hebben plaatsgevonden. Dit bied een goede basis voor samenwerking tussen bewoners en de gemeente.
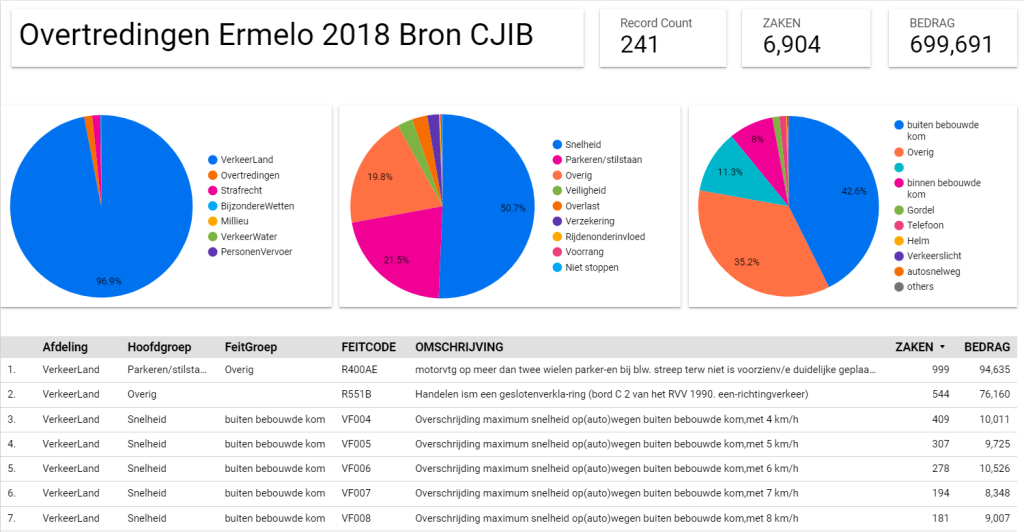
Iedereen begaat wel eens een overtreding. Het CJIB publiceert regelmatig een overzicht van alle overtredingen in Nederland. Wat kan je met deze data? Zo onderzoek ik hoe we deze data kunnen gebruiken voor het verbeteren van de leefbaarheid van onze buurt en wat dit zegt over de effectiviteit van de handhaving.
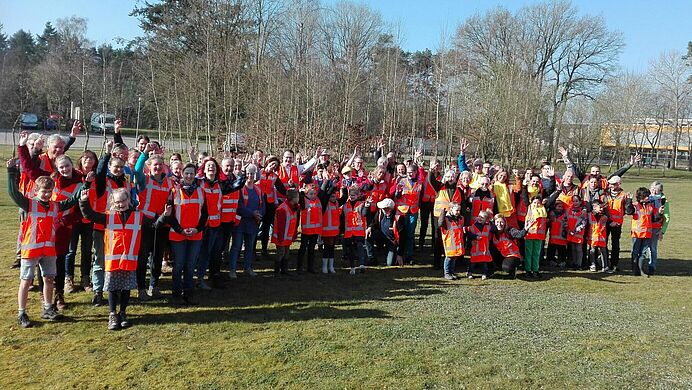
Elk jaar hebben we landelijke opschoondag in Nederland. Voorzien van afvalknijpers, vuilniszakken, veiligheidshesjes en handschoenen ging iedereen zijn stad of dorp schoner maken. Als vrijwilliger bij de wijkvereniging, IT-er en GIS hobbyist dacht ik: Hoe kan data hier bij helpen?
In januari is een bewonerswerkgroep gestart om extra aandacht te geven aan de verkeersveiligheid van Ermelo-West. In dit artikel beschrijven we onze aanpak waarbij we gebruik maken van een aantal handige internet tools voor het verwerken en presenteren van de data.
Inventarisatie Verkeersveiligheid met moderne hulpmiddelen
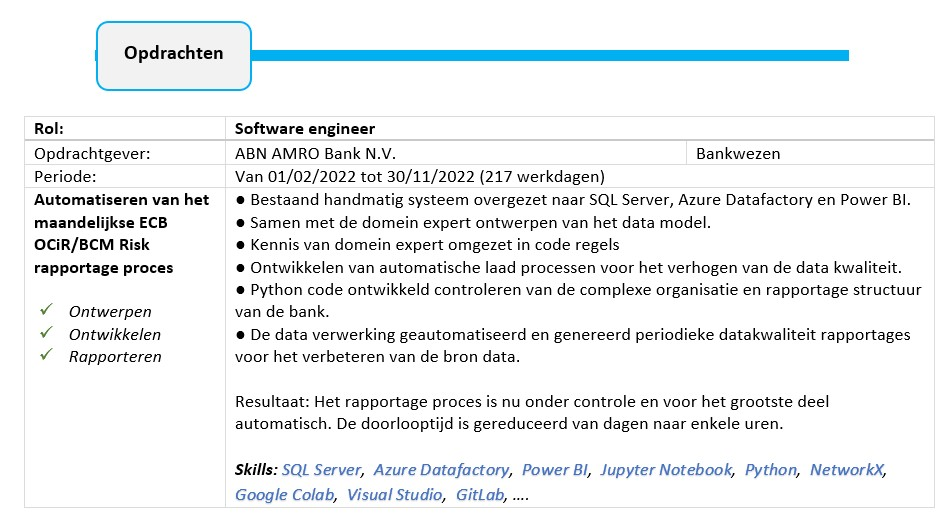
Automatiseren van het maandelijkse ECB OCiR/BCM Risk rapportage procesOntwerpen, Data analyse, Data modellering,Ontwikkelen, Documenteren,Rapporteren
Het begon met het begrijpen en analyseren van het bestaande handmatige systeem. De doelstelling was duidelijk: het rapportageproces efficiënter maken door automatisering, waardoor de betrouwbaarheid van gegevens en de snelheid van rapportage aanzienlijk werden verhoogd. Dit leidde tot de succesvolle migratie naar een geavanceerde technische stack, bestaande uit SQL Server, Azure Datafactory en Power BI.
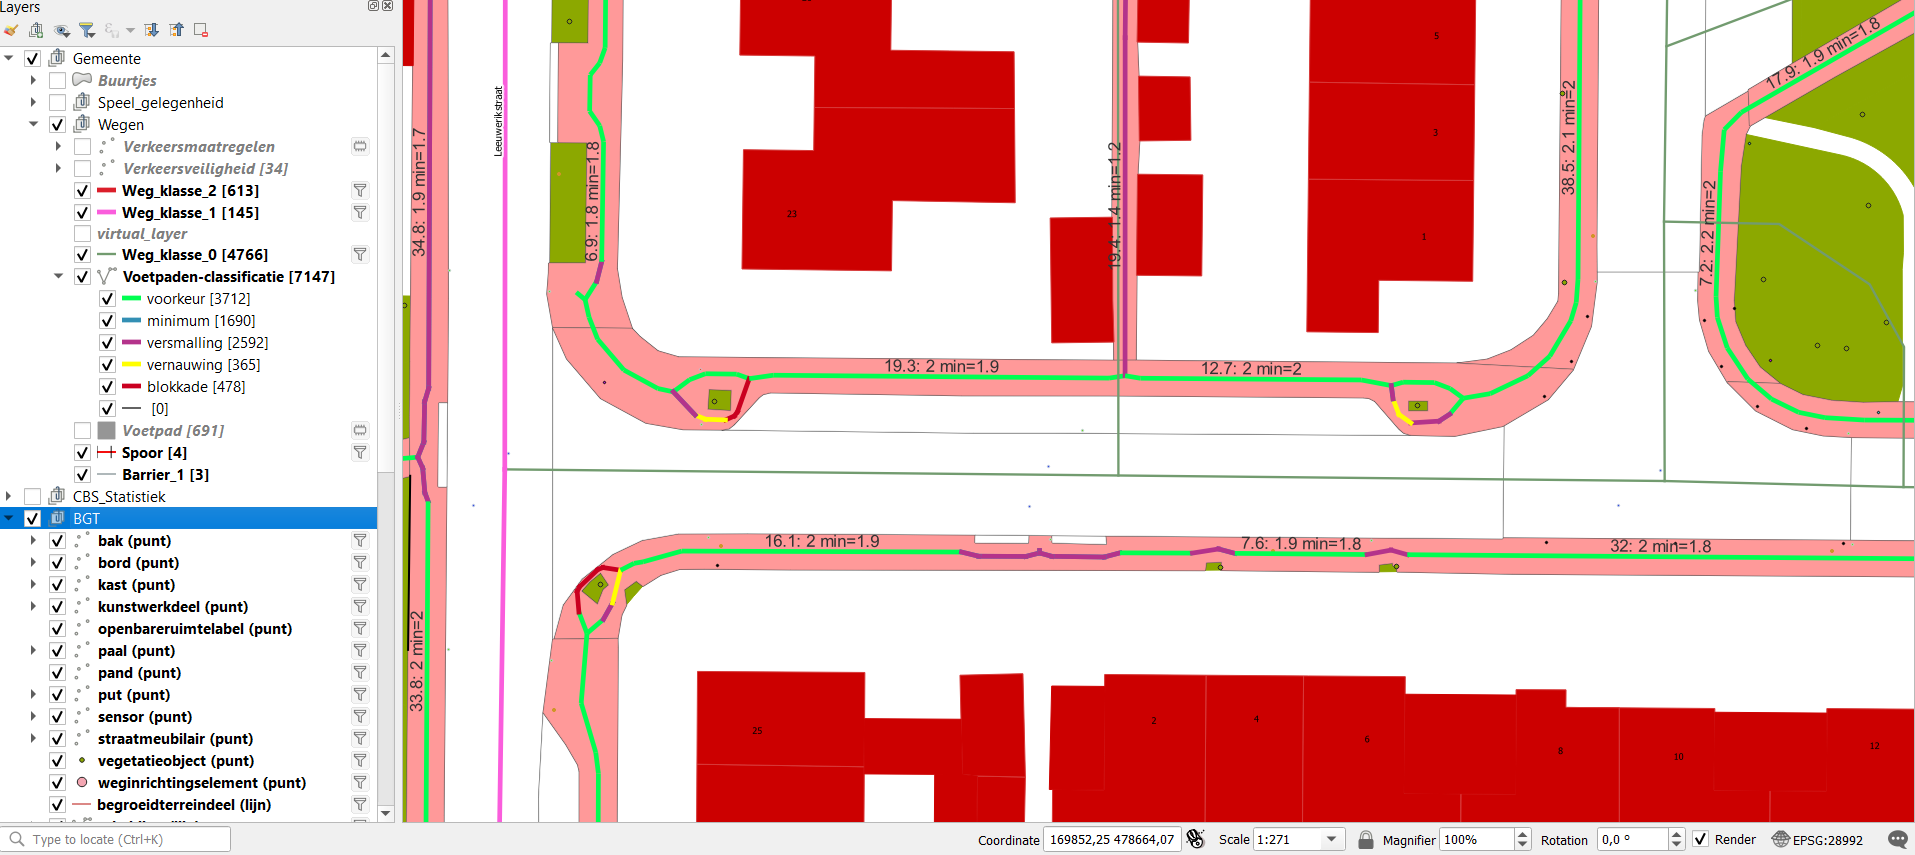
De wijkvereniging werkt aan een methode voor het inventariseren van voetpaden (stoepen) op de kenmerken vrije breedte en veiligheid. Dat is belangrijk voor onze gezondheid en sociaal leven. Hoe kan een modern geografisch informatiesysteem en wat ouderwets benenwerk ons daarbij helpen? We delen onze ervaringen.
Namen als Vasco da Gama, Marco Polo, Christoffel Columbus en James Cook blijven in ons geheugen gegrift. Hieronder een lijstje van 10 beroemde ontdekkingsreizigers die grote delen van de wereld in kaart hebben gebracht. Met wat geluk kom jij hier tussen te staan.
Verkende de noord- en noordwestkust van Afrika. Volgens sommige verhalen kwam hij tot Centraal Afrika, waar hij waarschijnlijk een van de eerste beschrijvingen van gorilla’s optekende.
Pytheas ( ca. 380 v.Chr.-310 v.Chr.)
Deze Griekse navigator, afkomstig uit Marseille in Zuid-Frankrijk, was de eerste die om de Britse eilanden voer, en verkende ook het huidige Duitsland.
Marco Polo (1254-1324)
De Venetiaan Marco Polo nam de zijderoute naar China en verkende jarenlang China en grote delen van West-Azië.
Jij
Je bracht je buurt in kaart en ontdekte nieuwe manieren waarop mensen elkaar kunnen ontmoeten. Hier zitten we echt op te wachten.
Welke tools en skills heb je nodig:
Doorzettingsvermogen en een goede regenjas
Enig inzicht in je omgeving (je moet tenslotte weer veilig thuis komen)
Een notitieblokje en een potlood (smartphone is ook handig)
Om een kaart te maken heb je informatie nodig. Die zal je eerst moeten verzamelen tijdens de ontdekkingsreis. In het eenvoudigste geval heb je de informatie al beschikbaar. Maar het kan ook zijn dat je die eerste met veel moeite moet verzamelen en bewerken tot deze geschikt is om op de kaart te zetten.
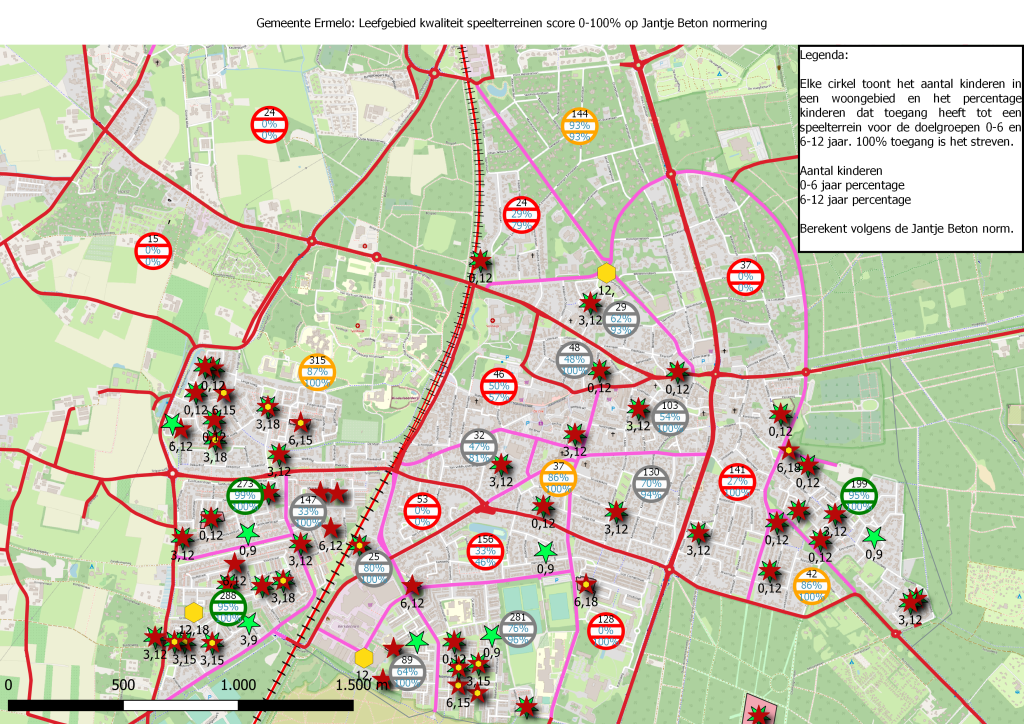
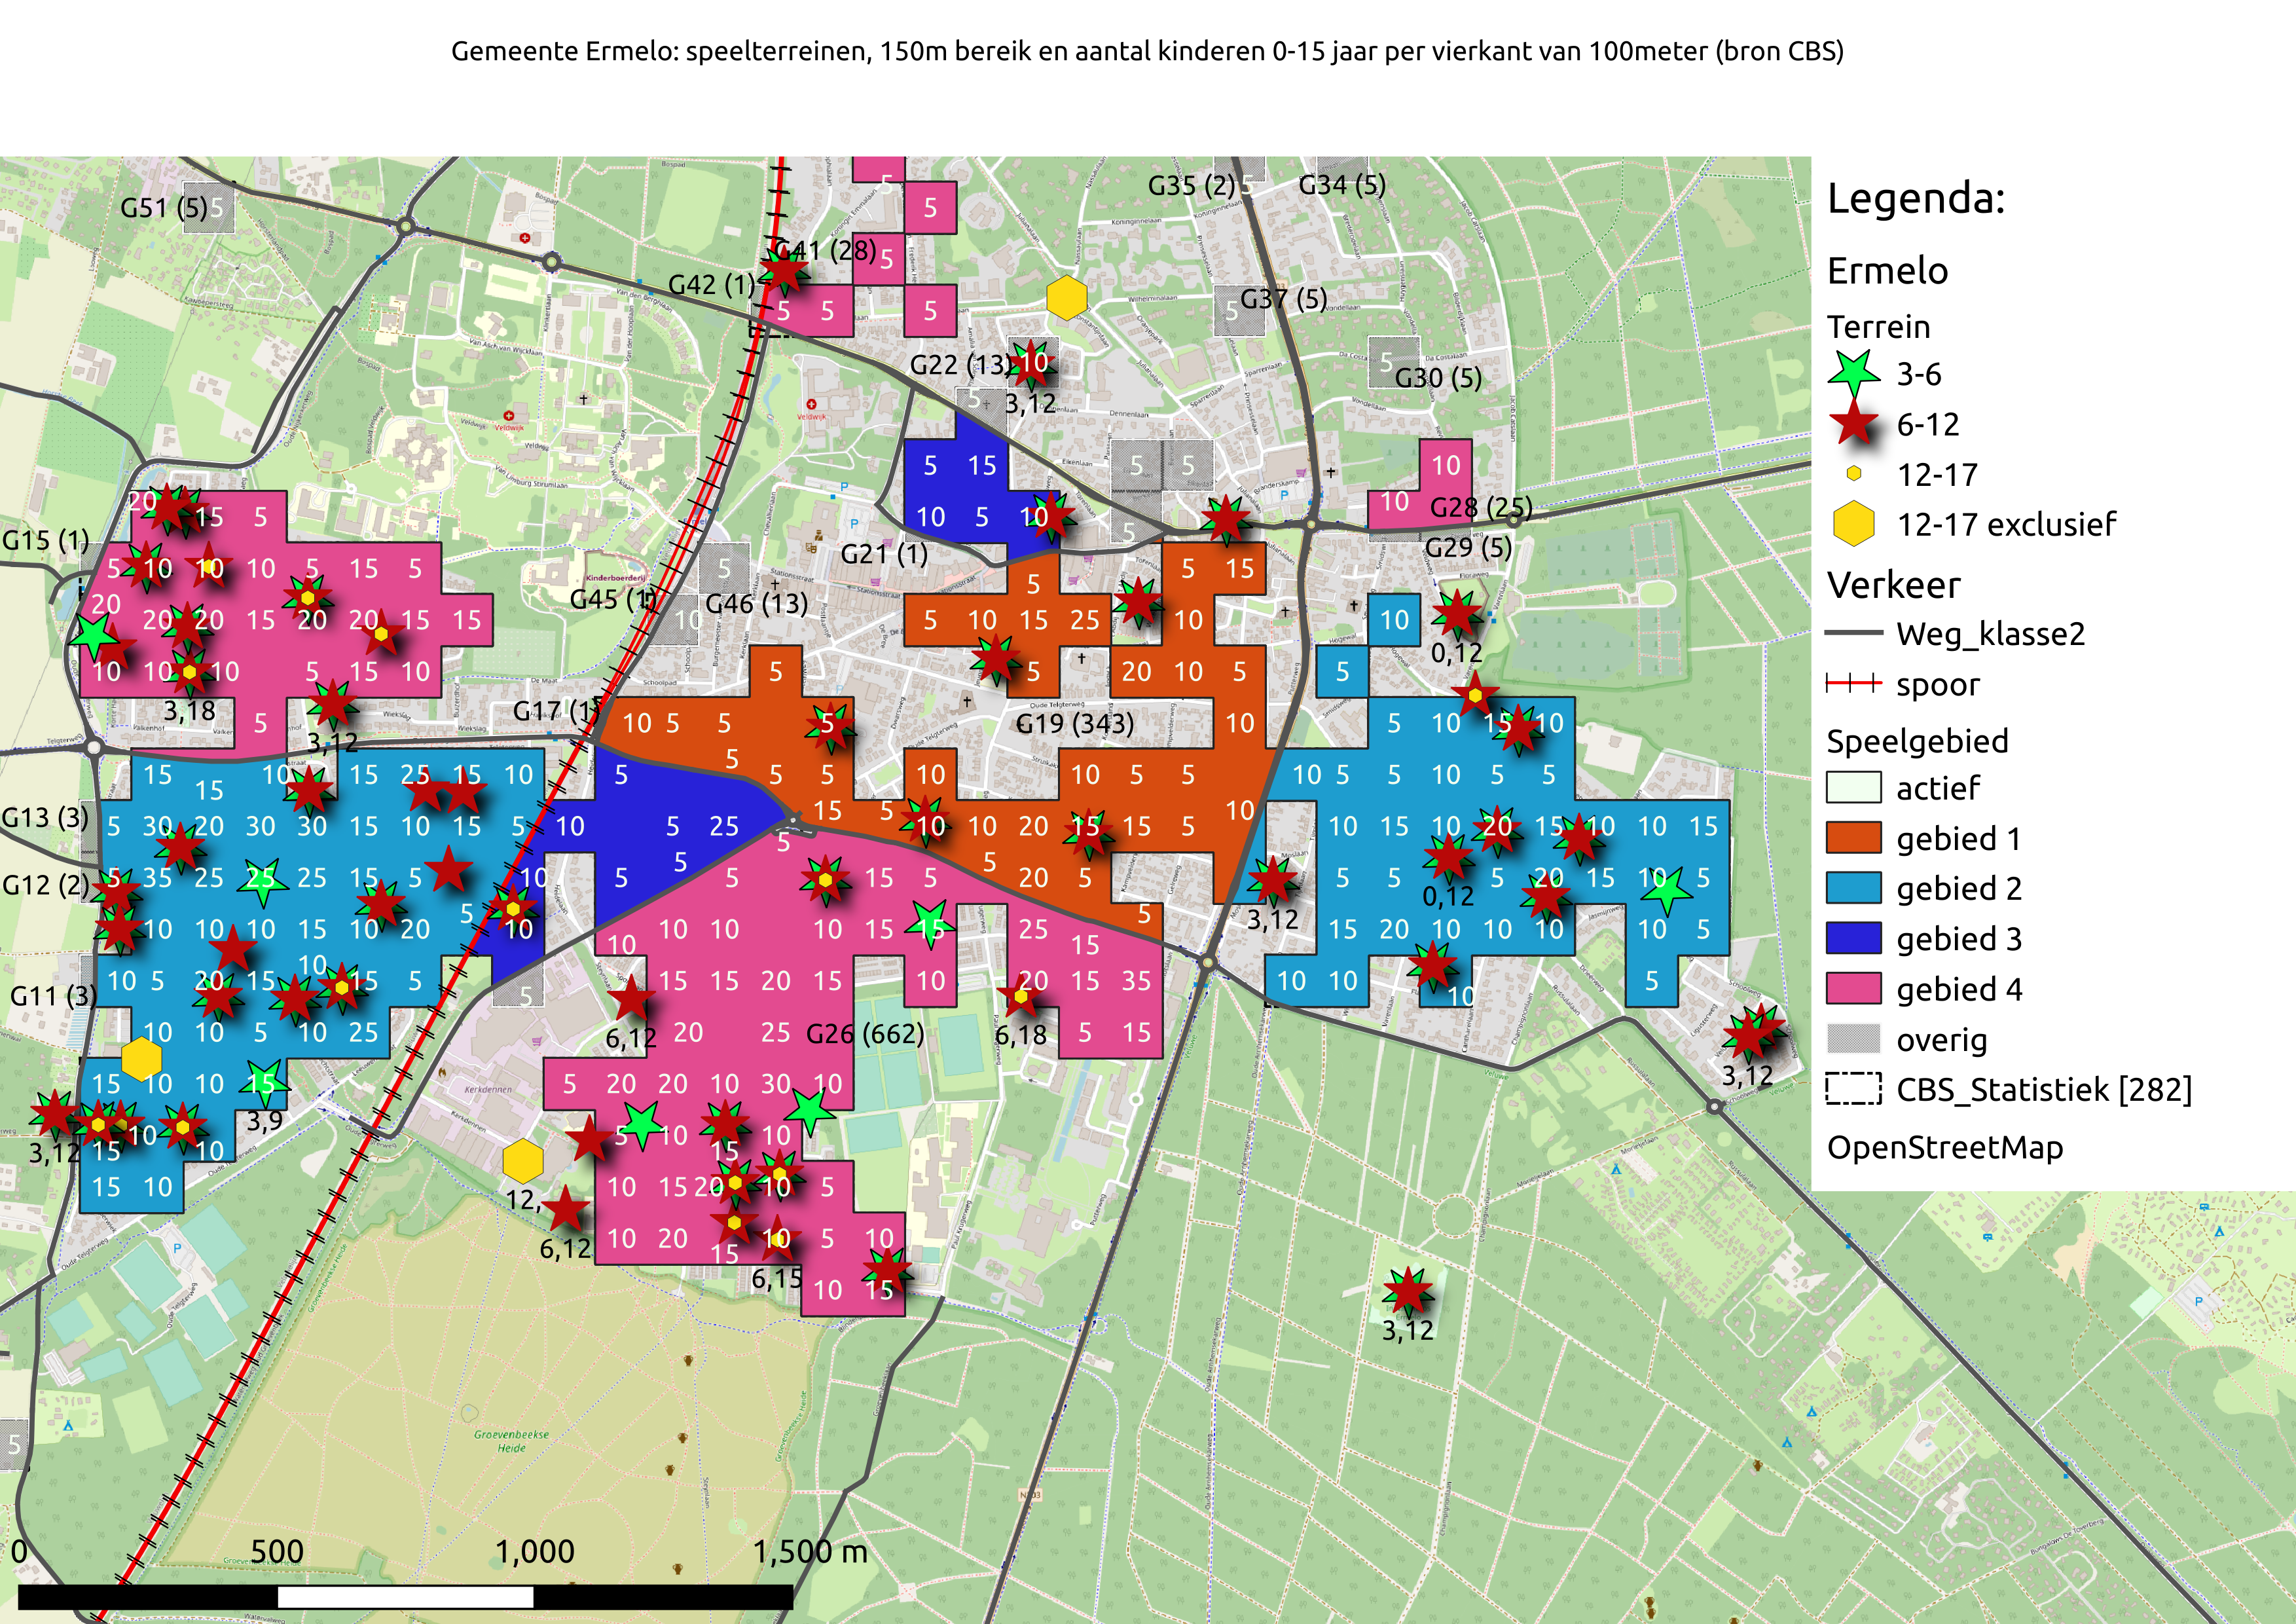
In een vorige blog post ben ik begonnen te schrijven over burgerparticipatie. Kernidee is dat buurtbewoners niet hoeven te wachten op een uitnodiging van de gemeente maar zelf het initiatief kunnen nemen. Als voorbeeld beschrijf ik hoe je de speelvoorzieningen in de wijk kan inventariseren en vergelijken met de norm om hiermee verbetervoorstellen op te stellen. De kennis die ik heb opgedaan is hiermee beschikbaar voor alle buurtbewoners en wijkverenigingen.
Analyseer je buurt, verzamel argumenten en werk samen met de gemeente aan verbetering
Met de Omgevingswet krijgen burgers nieuwe mogelijkheden om invloed uit te oefenen op beslissingen over hun leefomgeving. Burgerparticipatie is een door de gemeente of projectontwikkelaar geregisseerde activiteit, meestal aan het einde van een lang planning en voorbereidingstraject. Dit geeft de indruk dat er nog maar weinig bij te sturen valt.
Met de juiste data wordt bewonersparticipatie wél een succes
Maar wat als burgers het proces omkeren en zelf plannen gaan ontwikkelen? In dit artikel beschrijf ik wat burgers zelf kunnen doen met hulp van openbare data en open source software.
De burger krijgt een grote verantwoordelijkheid, de overheid doet stappen terug en moet haar dienstverlening opnieuw inrichten
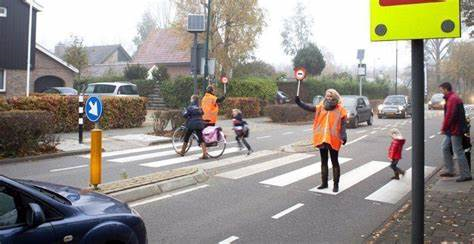
Hoe veilig is mijn buurt? Zijn er gevaarlijke wegen, kruispunten en oversteekplaatsen. Hoe kan ik mijn kinderen veilig naar school laten fietsen. En wat kan ik zelf doen om de veiligheid te verbeteren. Deze vragen rond de thema’s verkeersveiligheid zijn te beantwoorden als je beschikt over de juiste informatie. De overheid, gemeentes en grote bedrijven beschikken over die informatie, maar helaas is die niet voor iedereen even toegankelijk. Je mag erop vertrouwen dat de gemeente het beste doet voor jouw buurt maar als je actief betrokken wilt zijn zal je zelf op zoek moeten gaan.
Overstekend kind tussen geparkeerde auto’sZo analyseer je zelf de situatie in je buurt
In dit artikel zoek ik naar data over de verkeersveiligheid in mijn buurt en straat. Zodat burgers met behulp van data en visualisatie tools zelf de antwoorden kunnen vinden.
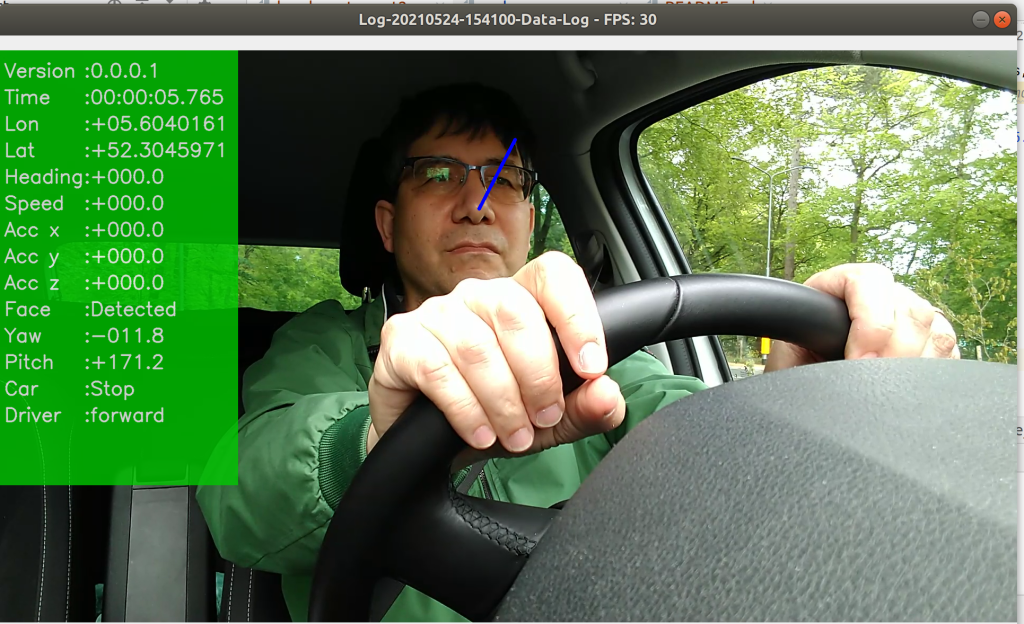
Tijdens de lessen voor je rijbewijs wordt je geleerd om iedere 5 à 8 seconden om je heen te kijken. Maar doen we dat ook zoals het hoort, blijven we dat ook doen? En zien we werkelijk wat er om ons heen gebeurt.
Ik werk aan de ontwikkeling van de DriverCoach, een innovatief systeem om rijgedrag te monitoren en de veiligheid te bevorderen. In dit artikel beschrijf ik hoe we het kijkgedrag kunnen bepalen en verbeteren.
Regelmatig in de spiegels kijken voor de veiligheid van jezelf en andere weggebruikers
Autorijden veiliger maken voor iedere automobilist en weggebruiker met serious gaming. Elke dag rij ik met de auto naar mijn werk bij de ANWB in Den Haag, een rit van meer dan 100 km door de bebouwde kom en over de snelweg. Goed en veilig autorijden is best moeilijk. In dit artikel presenteer ik een serious game aanpak waardoor ik steeds veiliger ga rijden. Deze werkwijze is onderdeel van DriverCoach een systeem voor veilig rijden.
Route met verkeerssituaties die om aandacht vragen
In dit artikel beschrijf ik het onderzoeksproject DriverCoach voor meer verkeersveiligheid door gedragsbeïnvloeding en de tot nu toe bereikte resultaten.
Elke dag rij ik net als vele anderen in mijn auto naar mijn werk. Maar doe ik dat wel veilig, economisch en efficiënt? Het onderzoeksproject DriverCoach wil daar een antwoord op geven. Het einddoel is een betaalbaar systeem voor iedere automobilist dat de verkeersveiligheid bevorderd.
Of all car accidents 94 percent are caused by driver error and 57 percent by distracted driving. A system that helps the driver to focus its attention on driving can reduce injuries and damages.
The driver coach system will check for 3D aspects:
Are you looking for information in tons of documents but struggle to find it? I have the same problem. So I started a literature search and setup a Data Science project on Semantic Search. To verify i’m heading in the right direction I did a POC on finding interesting phrases in the Holy Bible. This blog post is the first in a series, describes the outlines of the project and show the first result.
Presenting well is a challenge at the best of times. However, if your native language is not English, you may find yourself especially worried before your presentation. The following method will help you create and deliver a more successful presentation with style, ease, and confidence. The final product is an high quality audio-recording spoken by a native speaker (generated by a free text-to-speech service).
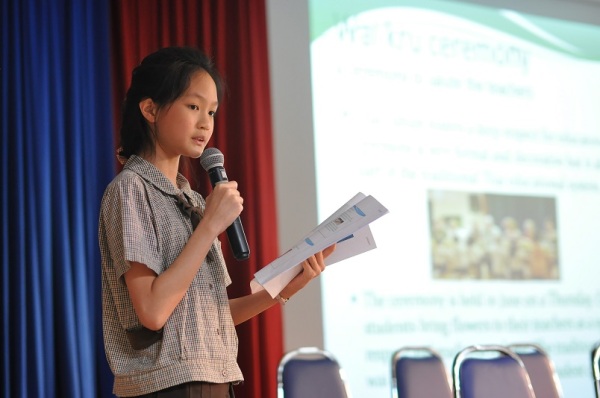
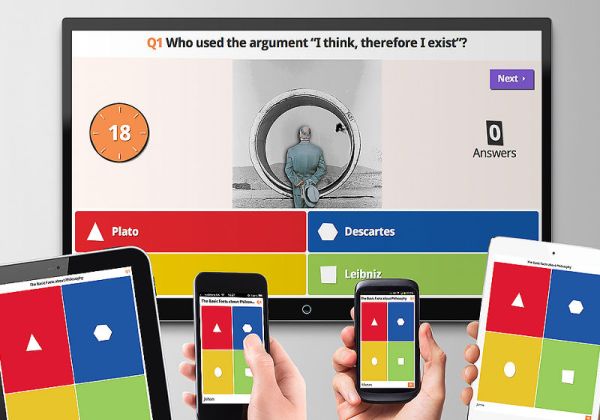
In this article I write how you can use interactive quizes in your classroom to spice up learning and have more fun. During my holiday in Thailand I visited Chumphon Phonphisai school (highschool). I was in Phon Phisai for 2 weeks to visit family and meet some friends. A teacher asked me to see her English students and help them to improve their conversation skills. I enjoyed my time at the school and even now i’m back in my home town i’m still thinking what i can do to help.
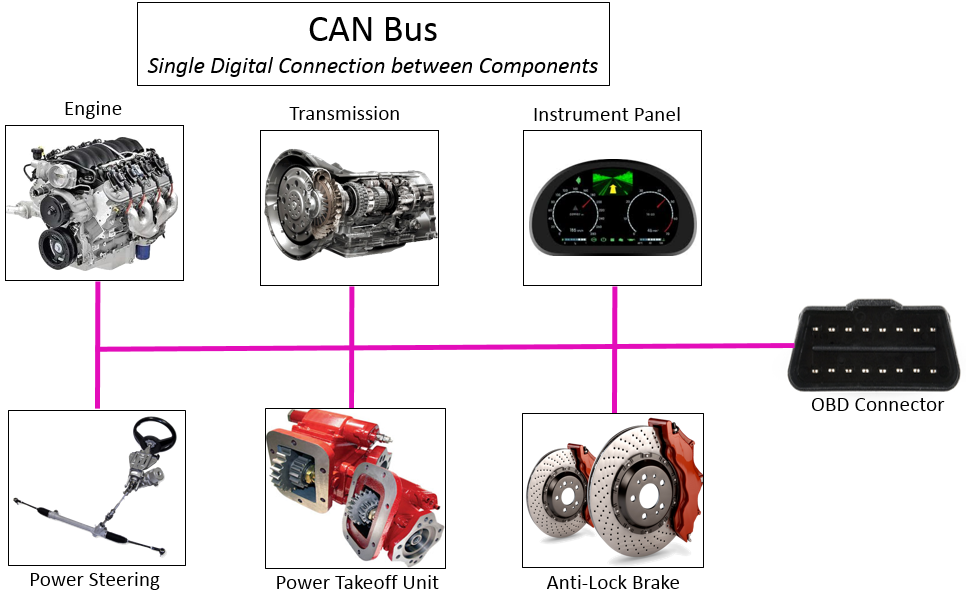
How can you collect valuable data from your car? In my ongoing project to improve car safety and my driving skills im looking for ways to collect data from my car. Im looking for basic driving data like speed, GPS location, acceleration and engine speed (RPM) but also more advanced information on engine temperature, battery health, steering angle, and ADAS (Advanced Driver Assistence Systems) supported by radar sensors and cameras. Continue reading →
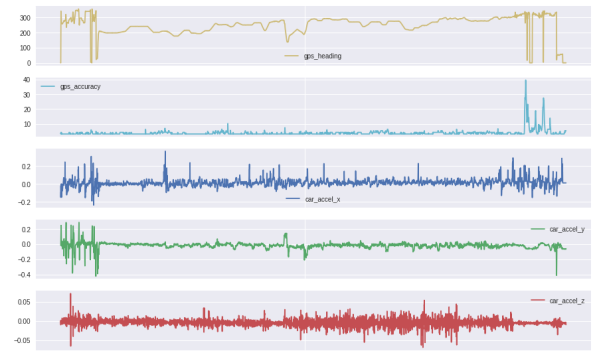
In this article I describe some of my experiences setting up a basic Connected Car IoT telemetry system in a proof of concept setting. In a previous post I described some tools and techniques to process data collected from my car. There the focus was on data post processing and analysis. Now i focus on collecting the data in a realistic day to day situation, me driving in my car to work.
The project was ignited by an internal company competition to find solutions to reduce distraction while driving. I came up with the idea to build a simple App that will detect if i’m in my car and if its moving or not. Continue reading →
In this article I describe how we can use car data to improve driving safety, save fuel and the environment.
Every day i drive my car for more than 1 1/2 hours to work. Over the years I have collected a large amount of experience, but does this imply that i am an expert driver? The answer might be found in the data. Lets find out what we can learn and see how to apply it to a business case. Continue reading →
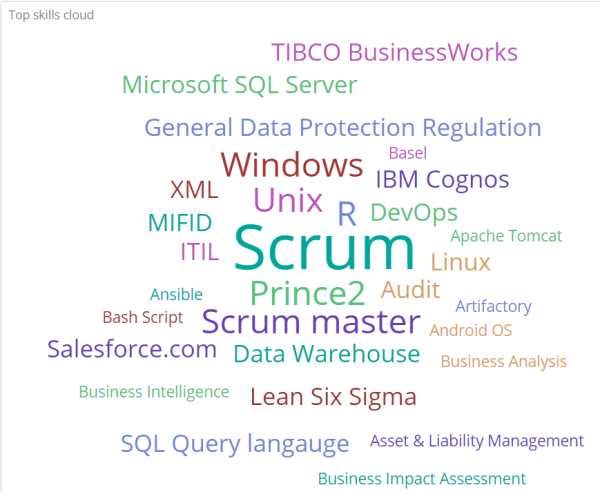
In my previous blog post i wrote about the SkillMatch system that i am buidling for scanning job portal sites and extracting valuable information. In this post I write about its user interface. Continue reading →
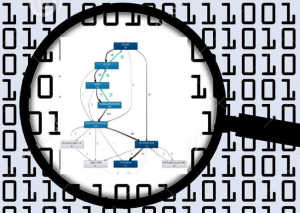
How can we extract valuable information from unstructured data such as text documents. Financial compliancy, knowledge management and crime fighting are applications waiting for solutions to mine this data. In this article i describe how i build Skillmatch a job matching system as a practical example how to use this technology. Continue reading →
Effective monitoring of thousands of IT Services requires you to transform realtime data streams into actionable alerts and high level situation overviews. In this blog post I will describe how to create reliable alerts and reduce the problem of alert storms by clustering.
This blog is part of a series of blogs on setting up a Smart monitoring system.
In my previous post on monitoring I wrote about setting up customer activity monitoring supported by anomaly detection. Now I will show how to monitor hundreds of services without drowning in data. The solution i present processes raw monitoring metrics and turns that data into actionable alerts and usefull insights.
In this article I’ll describe how I implemented customer activity monitoring and anomaly detection. If you are a service provider that provide services to a group of large accounts its vital to know that your customers can do their business.
Monitoring customer behavior is not only required for managing IT operations its also vital to know from a business point of view. Nowadays customers get smart too. High tech customers such as Netflix and Airbnb use data analytics to monitor the results they get from their payment providers. Based on this data they make real-time decisions to switch to another supplier when that better suits their needs.
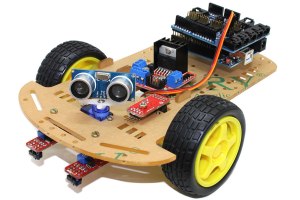
My personal experiences programming the Makeblock mBot robot. I’m investigating this robot in order to use it as a tool for teaching technology and programming at an elementary school.
The mBot robot can be programmed with the Makeblock editor an application based on Scratch from MIT Media Lab. The editor and example programs can be downloaded from http://www.mblock.cc/. There are also other options such as on online web browser application and apps for Android and the iPad. Continue reading →
Last week I attended the ING Business Continuity conference in Amsterdam as a speaker. More than 140 participants from all over the world discussed for two days how reliability of IT services could be improved, handle major incidents and recover from disasters. My presentation on Smart monitoring provides an practical approach how to improve reliability of IT services.
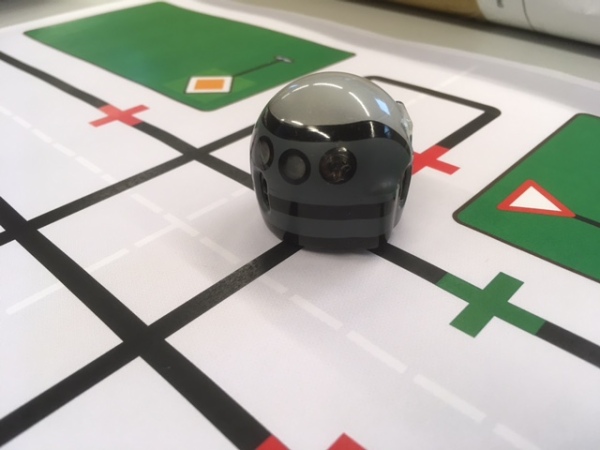
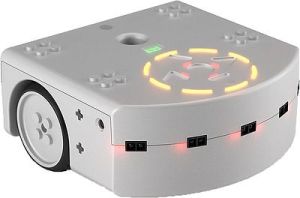
Het is belangrijk om te weten wat de sensors van de Ozobot robot kunnen. Om de mogelijkheden van de Ozobot beter te leren kennen heb ik een aantal eenvoudige metingen verricht met een lineaal en een stuk wit papier als ondergrond. De robot geeft zelf aan of hij een voorwerp ziet door dit te roepen of een meetwaarde uit te spreken. Continue reading →
Hoe kunnen robots worden ingezet op school. De school van mijn dochter maakt dit jaar gebruik van robots zoals de Ozobot als hulpmiddel voor de introductie van logisch denken en programmeren. Als vader en IT-er ben ik geïnteresseerd in de mogelijkheden van deze robot. Daarom kocht ik gelijk het model EVO om eens te kijken wat deze robot wel allemaal kan. Ambitieus als ik ben wilde ik gelijk het hoogst bereikbare onderzoeken en stelde mij als doel: “De robot programmeren als een echte verkeersdeelnemer”.
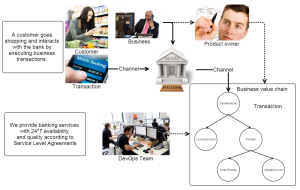
Successful enterprises constantly seek new ways to improve availability of their services, and try to avoid compliance breaches. This can be achieved by managing services on an end-to-end basis. By analyzing the topology of end-to-end business value chains you gain insight into the behavior of your systems in a way you have never seen before.
Changing the clock confuses humans and computers as well
This weekend all over the world hundreds of servers went down, millions of transactions failed and data was lost due to daylight saving time confusion. This recurring event happens every time we change the clock between winter / summer time because of daylight saving time. In this article I explain the cause of the problem. I also provide some hints on how to prevent these kind of problems. Continue reading →
While most companies manage their services on the physical component level some are beginning to manage them at the transaction and business process level. This because they want to understand their customer journey or need to have a complete audit trail in order to meet compliance requirements. In this post i will describe the basics of analyzing business transactions. Continue reading →
Microservices promise to deliver new business services faster and at lower cost, but it comes at a price: increased operational complexity. I share my vision on managing microservices on the enterprise level:
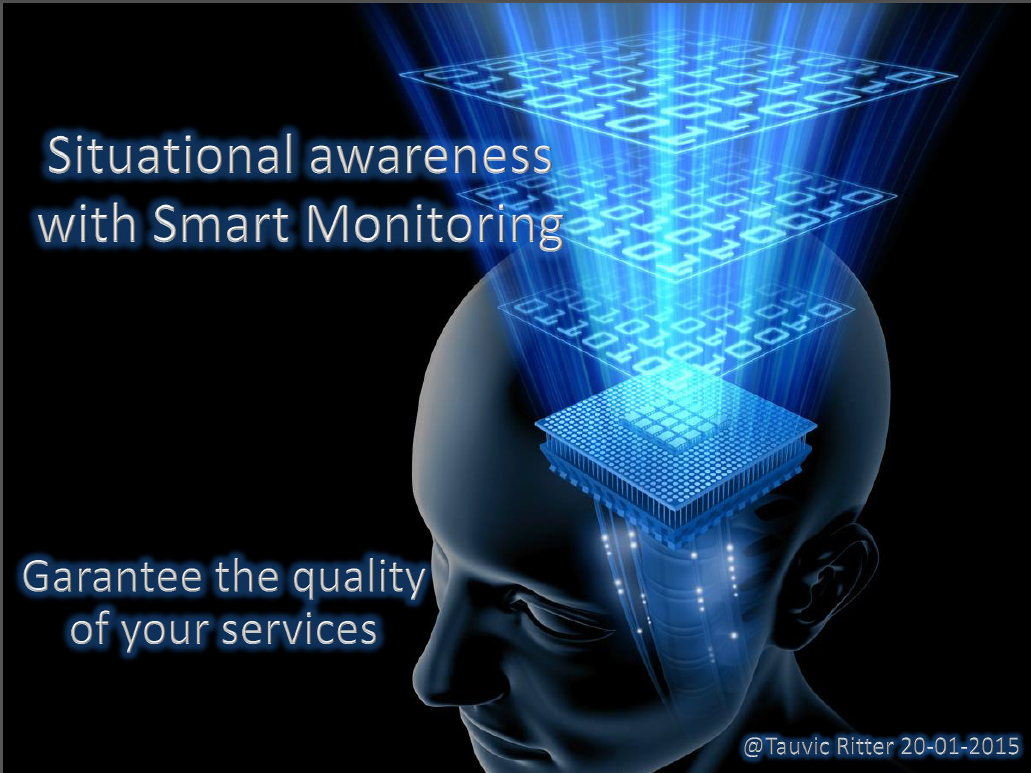
If you want to offer your customers IT services and promise them 99,9% availability then Service monitoring is essential. Smart Monitoring is a philosophy and way of working to achieve that goal. It enables you to understand your complex IT and be in control. In this article I will give you some guidelines and a basic plan how to get started.
The dashboard shows information on several services and how they conform to SLA defined KPI’s such as response time target. You can see how these services perform, what results they return (success, functional and technical errors) and drill down by Team.
During my period at ING Bank, I was part of the forward-thinking 4WRD DevOps team, focusing on the Basel II reporting system. This project involved transitioning a mainframe application to the ING Data Lake, utilizing Netezza Data Warehouse and IBM Infosphere Datastage for improved data management and reporting.
There where two major challenges:
Understanding the inner workings of the legacy system that was for a large part based on mainframe DB2 data and COBOL code.
Creating a new working solution based on Datastage and Netezza. Both tools nobody in the team had worked with before
At first sight this looked overwelming for our small team of six. We took a practical approach of learning on the job. We started with the easiest looking datastream and implement a full end to end data flow. We learned and gradually improved our methods for documenting, coding and testing.
My role was pivotal in establishing a robust deployment pipeline, crafting ETL (Extract, Transform, Load) data transformations, executing monthly Basel reporting batches, and offering comprehensive technical support to our team. In overseeing operations, I ensured the system’s reliability and efficiency. Moreover, as a developer of team tools, I innovated automated deployment strategies using a suite of technologies including Gitlab, Jenkins, Artifactory, Ansible, and Bash scripting, coupled with IBM Datastage for deployment tool sets.
Our team’s accomplishments are notable. We successfully processed monthly data for over 8 million customers regarding unsecured loans and credit cards, using IBM Datastage ETL jobs to handle the data and storing the outcomes in a Netezza warehouse. We pioneered a continuous deployment process, integrated FitnesseDB for regression testing, and meticulously stored every code asset on Gitlab. This comprehensive approach not only facilitated seamless deployment but also provided a solid framework for recovery from any setbacks.
In an effort to share our journey and methodologies with others, I created an engaging animation depicting Team 4WRD’s development of the Basel II reporting system. This animation showcased our dynamic workflow and updates to various assets, produced using the open-source visualization tool Gource.
In the old days we just had to manage a single mainframe and a private network with terminals and printers. Now technology has evolved into service oriented, REST-api based, lightweight, runs in the cloud and communicates with tens of other services. Developing these services takes a week and deployment is fully automated. So the Agile DevOps factory is spitting out new services every minute.
This results in a higly dynamic environment and it becomes a real challenge to manage thousands of micro services. How do you get an overview on the current state of your system. That is what the next video explains.
Nowadays the large companies and institutions have complex IT Services to support business value chains that execute millions of business transactions around the clock. All this business activity need to be monitored for problems and technical failures.
Question: How can we assure 99.7% availability and reduce cost at the same time ???
In this article I will describe how a typical company monitors their IT services and how it can achieve situational awareness.
Een mooie demonstratie over de belevingswereld van een robot. De robot word aangestuurd vanuit de ontwikkelomgeving Wolfram Mathematica en geeft daar ook zijn sensor data weer naar terug. Zo krijg je een goed beeld wat er zoal om gaat in het brein van de robot.
Mijn SoccerRobot gebaseerd op de V-REP robot simulator is weer een stap verder. Het speelveld is nu uitgerust met een echt goal, de robot is een eenvoudig model met twee wielen. De simulatie berekent een pad vanaf de huidige positie van de robot tot een punt vlak bij het doel. Hierbij word rekening gehouden dat de robot langs de verdedigers moet rijden.
In een volgende versie kijk ik naar een plan in drie fasen:
Om snel en goedkoop te starten maak ik gebruik van de V-REP Robot Simulator. De V-REP software is ontwikkeld door een professioneel bedrijf maar is nu open source en gratis te gebruiken. Hier is mijn eerste versie van een robot die wellicht kan gaan voetballen. Hij is nog jeugdig en volop in training dus nog even geduld.
De Thymio II is erg leuk, geheel gebruiksklaar en specifiek ontworpen voor de educatie van kinderen en heeft een CE-keuring. De robot is ontwikkeld in Zwitserland door een aantal gerenommeerde onderzoeksinstellingen en tegen kostprijs verkrijgbaar.
Ik start hier een blog sessie over robots voor mensen die geïnteresseerd zijn in robots voor hobby en educatie en net als mij er pas mee zijn begonnen.
Waarom mijn interesse in robots:
Ze zijn leuk en interessant
Ik heb een opleiding eletronica gedaan en wil daar weer wat mee gaan doen
Wellicht heeft mijn dochter interesse in robots en programmeren
Misschien kan ik andere kinderen hiervoor interesseren (code-dojo)
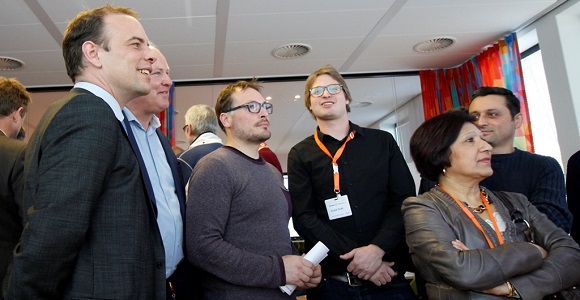
The xPerience is an annual technology market at ING. This was an excellent opportunity for me to present Smart Monitoring an innovative solution for end to end monitoring.
More than 500 engineers, product owners, chapter leads and managers visited the event that was all about experiencing the capabilities and approaches that help us building the next generation digital bank.
Waar komen al die internet bankieren storingen toch vandaan en wat kan je er er aan doen?
Veel bedrijven richten hun aandacht op het snel ontwikkelen en in de markt zetten van nieuwe diensten. Deze wens naar snelle ontwikkeling word ondersteund door de Agile werkwijze waarbij scrum ontwikkelteams continue en in korte sprints van enkele weken nieuwe componenten opleveren. Door diverse oorzaken raakt het beheer van de bestaande diensten wat op de achtergrond en de kwaliteit van de geleverde diensten neemt af. In dit artikel wil ik “Smart Monitoring” introduceren, een werkwijze voor het efficiënt en effectief monitoren en verbeteren van stabiliteit en beschikbaarheid van IT services.
My current role at ING is incredibly exciting as I have the opportunity to coach and train individuals across three diverse DevOps teams, enabling them to excel in the pivotal SMT role. These teams at ING are at the forefront of developing and managing SOA services based on TIBCO ActiveMatrix / BusinessWorks. Embracing the Scrum method and Continuous Delivery Engineering Practices, we work collaboratively in short, dynamic sprints. The role of an SMT member (Service Management Team) is truly stimulating, involving deploying and testing new services, proactively resolving issues, expertly handling incidents, and diligently managing daily operational tasks.
The ProRail InfoPlus system is a messagingplatform that seamlessly delivers round-the-clock information to travellers. With the capability to process thousands of messages per hour, the system serves as a vital link by transmitting data over a TIBCO Enterprise Service Bus to external parties, such as OV9292. In this crucial project, I have been entrusted to provide invaluable assistance to sub-contractor Conclusion Future Infrastructure Technologies in the delivery of 7*24 Gold support. Conclusion will extend remote support for the TIBCO Enterprise Service Bus, while I hold the responsibility of effectively preparing the remote support team for this significant undertaking.


 In my previous blog post i wrote about the SkillMatch system that i am buidling for scanning job portal sites and extracting valuable information. In this post I write about its user interface.
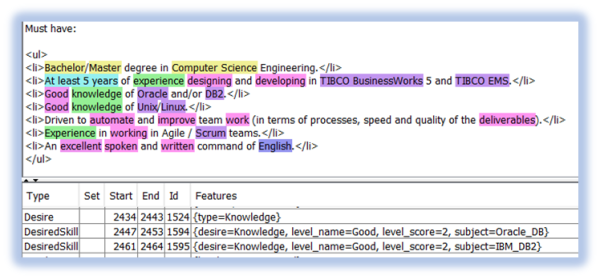

 In my
In my  In this article I’ll describe how I implemented customer activity monitoring and anomaly detection. If you are a service provider that provide services to a group of large accounts its vital to know that your customers can do their business.
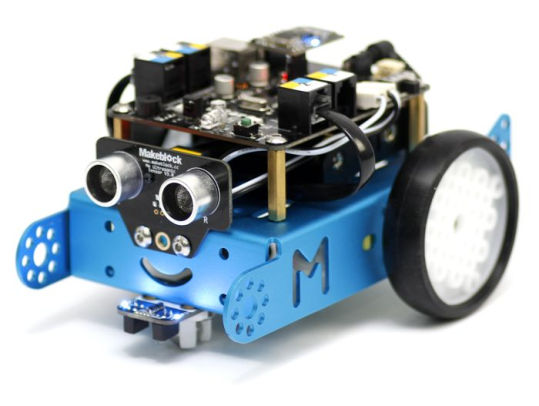 My personal experiences programming the Makeblock mBot robot. I’m investigating this robot in order to use it as a tool for teaching technology and programming at an elementary school.
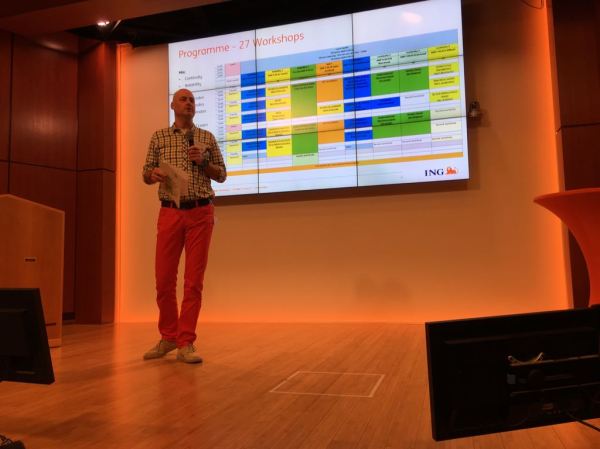


 Microservices promise to deliver new business services faster and at lower cost, but it comes at a price: increased operational complexity. I share my vision on managing microservices on the enterprise level:
 Nowadays the large companies and institutions have complex IT Services to support business value chains that execute millions of business transactions around the clock. All this business activity need to be monitored for problems and technical failures.
 De
De